Featured
LLM Visualizer
A local logging proxy and browser-based viewer for Claude Code and Codex CLI traffic — every request, response, and tool call, grouped into sessions and rendered as structured, diffable exchanges.
- Stack
- TypeScriptpnpm workspacesReacttRPCReact QuerySQLiteNode.jsVite
The problem
Claude Code and Codex CLI talk to their model APIs constantly, but that traffic is invisible. When a session goes sideways — a tool call with the wrong arguments, a system prompt that silently grew too large, a response that got cut off mid-stream — there's no way to go back and look at exactly what was sent and received. You're left guessing from terminal scrollback.
I wanted a real inspector: a proxy that transparently logs every exchange, a storage layer that doesn't lock me into one format, and a viewer that can turn raw JSON payloads into something I'd actually want to read.
Approach
The project is a pnpm workspace split into focused packages, each with a narrow job:
packages/canonicalnormalizes Anthropic and OpenAI-shaped payloads into one schema — messages, tool calls, tool results, reasoning blocks, usage — so the viewer doesn't need to know which provider format it's looking at.packages/storagedefines a storage port (currently backed by SQLite) that persists exchanges and, for streaming responses, the raw SSE chunks in sequence.apps/proxysits between the CLI and the upstream API, forwarding every request unmodified while writing a copy of the request/response pair — headers, body, timing, streaming state — to storage.apps/vieweris a tRPC + React Query app that reads that storage and renders it: a session list, a per-exchange timeline, and drill-down views into headers, canonical content, and raw stream data.
Key features
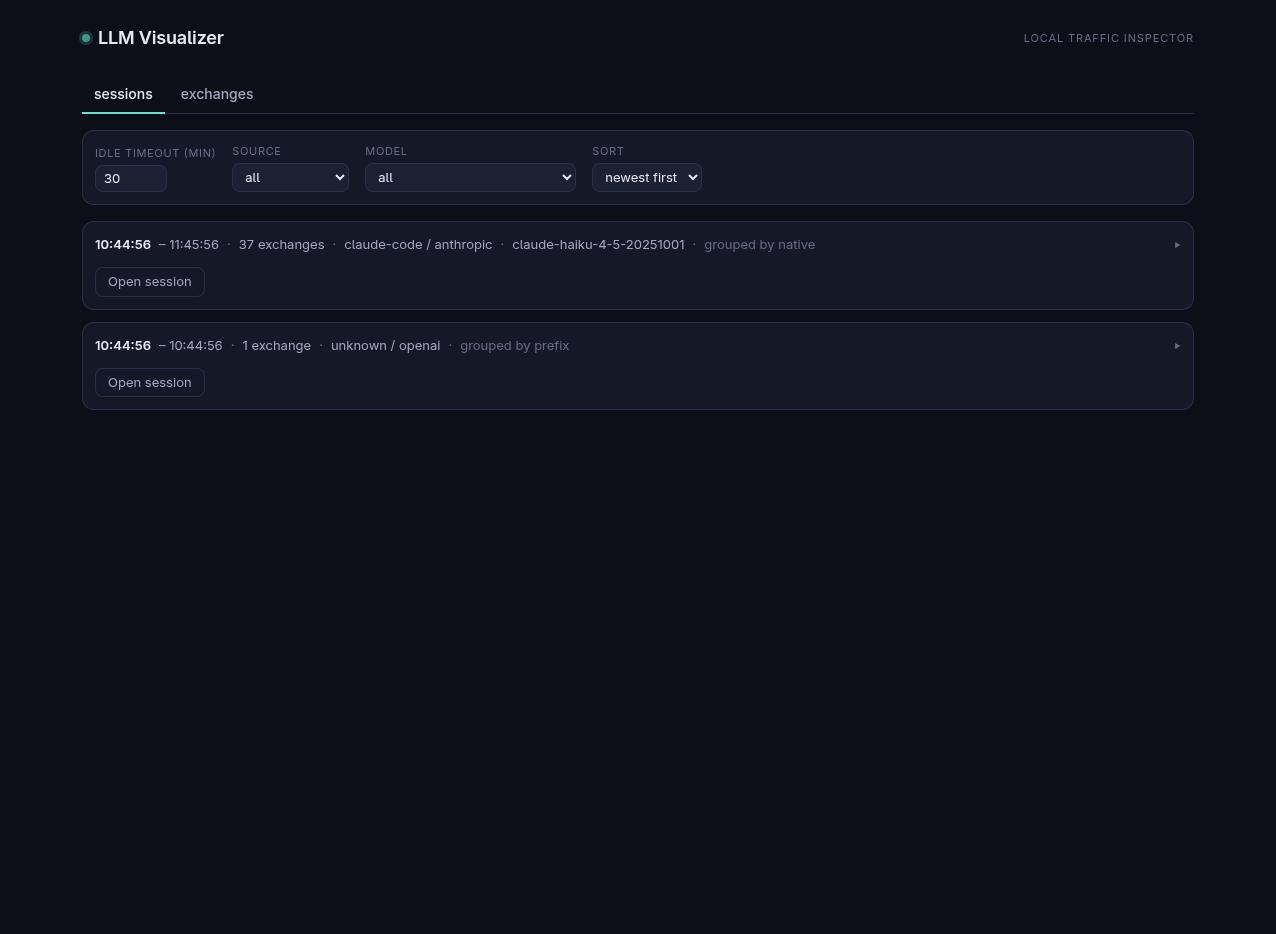
Session grouping without a stored concept of "session." Neither Claude Code nor Codex sends an explicit session identifier as a first-class field, so sessions are derived: a two-tier strategy first looks for a native session signal (I found Claude Code embeds one inside metadata.user_id in the request body, JSON-encoded), then falls back to matching canonical message-history prefixes across exchanges within an idle-timeout window. Getting this right turned one real Claude Code session that was fragmenting into four separate rows in the UI back into one.
Three ways to look at the same exchange. Every exchange can be viewed as a diff (what changed since the last turn), canonical (normalized, human-readable messages, tool calls, and tool results), or raw (the actual request/response JSON, headers, and — for streaming responses — every individual SSE chunk in order).
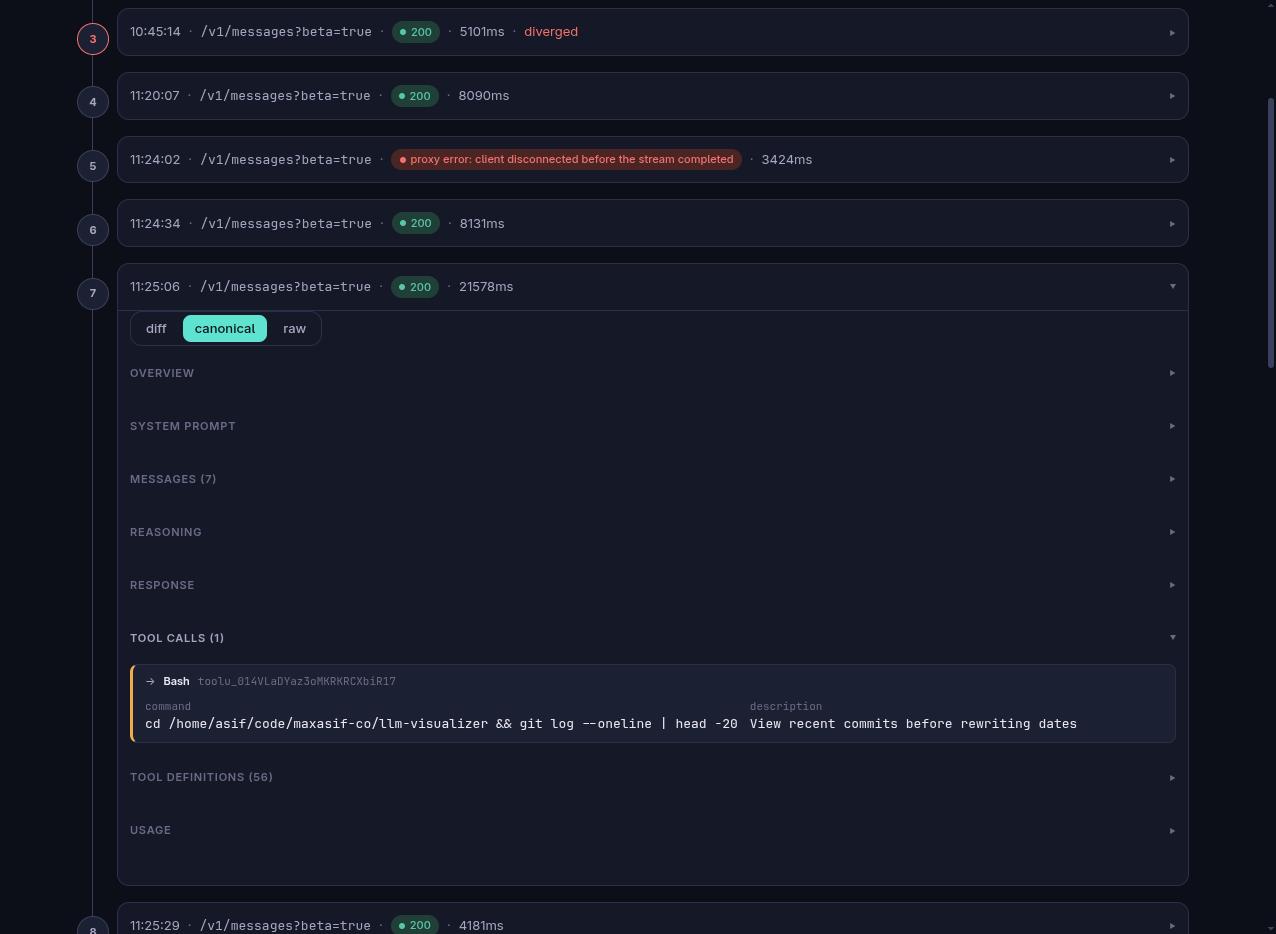
Tool calls rendered as first-class citizens, not buried in JSON. A tool_use block shows the tool name, ID, and arguments as a key/value table; the matching tool_result is linked back to it by name, with error results visually flagged.
Collapsible by design. Real sessions run to dozens of exchanges. Exchange cards and every section within them (overview, messages, tool calls, tool results, usage) collapse by default and expand independently, so a 37-exchange session is scannable rather than an overwhelming wall of JSON.
What was interesting
The session-grouping bug was a good debugging exercise. I ran one Claude Code session and the viewer showed four. Rather than guess, I queried the SQLite database directly, pulled the raw request bodies, and grepped for anything resembling a session identifier — which is how I found metadata.user_id held a JSON-encoded string containing session_id. Confirming the fix's premise against real data before writing any code meant the fix worked the first time.
Storage as a port, not a database choice. Defining a small storage interface up front — rather than hard-wiring SQLite queries throughout — means JSONL or another backend is a matter of implementing the port, not rewriting the app.
Canonical normalization pays for itself immediately. Once Anthropic and OpenAI payloads both map to the same CanonicalExchange shape, every downstream view — diffing, tool-call rendering, usage bars — is provider-agnostic for free.
Architecture
packages/
├── canonical/   # Provider-agnostic request/response schema + normalizers
└── storage/     # Storage port + SQLite implementation (exchanges, chunks)
apps/
├── proxy/       # Logging reverse proxy in front of the model API
└── viewer/      # tRPC API + React/Vite UI
Screenshots
Sessions are grouped and summarized at a glance — exchange count, provider, model, and how the grouping was determined:
Drilling into a session shows the full timeline; each exchange expands into overview, messages, tool calls, and usage — like this real Bash tool call with its command and description rendered as a structured card:
Result
A working local traffic inspector I actually use day to day — session grouping now correctly collapses multi-exchange Claude Code sessions into one, tool calls render as readable cards instead of raw JSON, and the whole thing stays out of the way (collapsed by default) until I need to dig into a specific exchange.