LLM Visualizer: A Local Traffic Inspector for Claude Code and Codex CLI
What LLM Visualizer actually shows you — full prompts, tool calls and results, and every individual SSE stream event — and how to point Claude Code or Codex CLI at it.
Every time Claude Code or Codex CLI talks to a model API, an HTTP request goes out and a response comes back. Normally that's invisible — the CLI consumes it and shows you text in a terminal, and everything else (the system prompt it actually sent, the tool call it just made, the individual events of a streamed response) disappears the moment it's read. LLM Visualizer is a local proxy plus a browser UI that keeps all of it, so you can go back and look at exactly what was sent and received, exchange by exchange.
What you actually get to see
The full prompt, not a summary. Every exchange shows the complete message history sent to the model — every user message, including the ones your CLI generates on your behalf. Claude Code in particular injects a lot you never see in the terminal: system reminders about available subagents, tool-use policy notes, environment context. Here's a real one, captured mid-session:
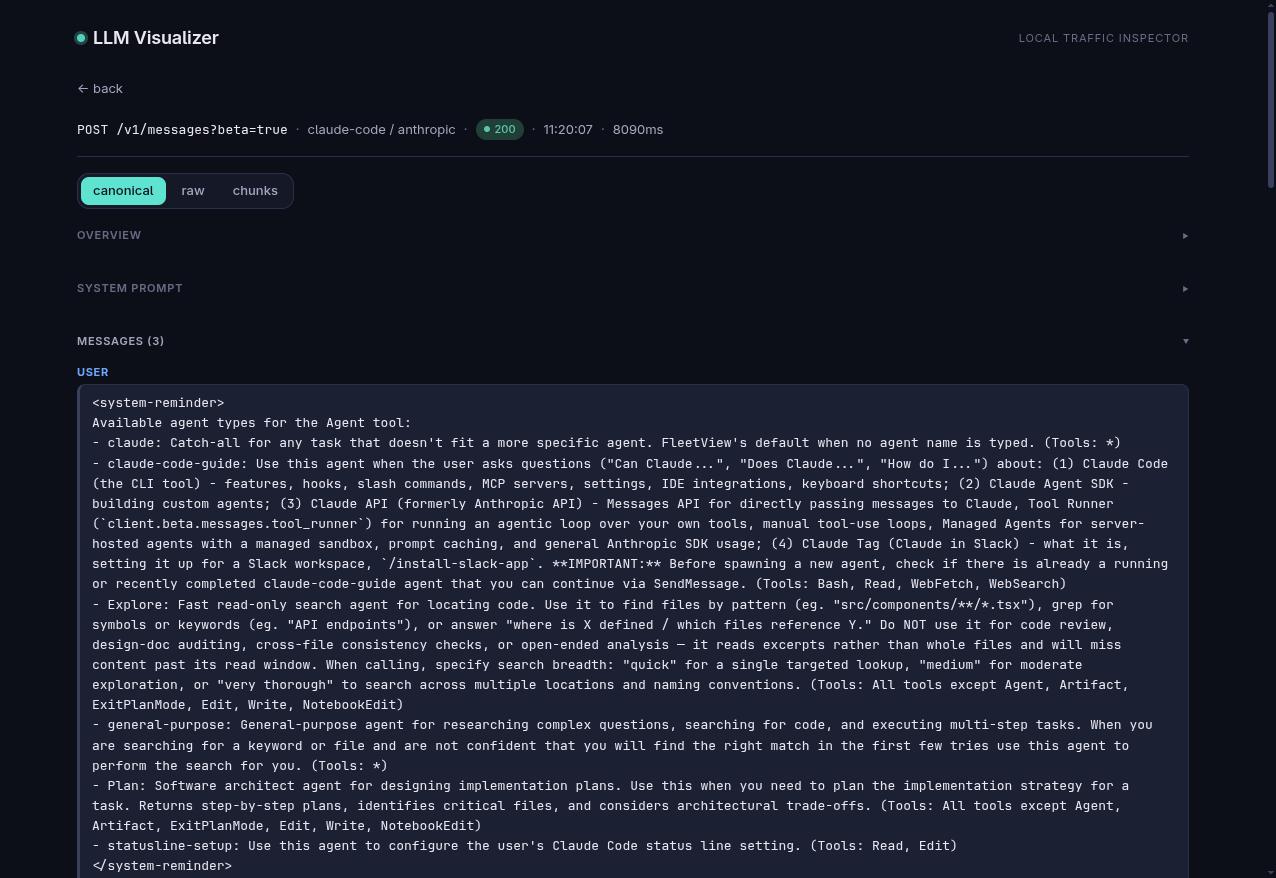
That's the actual text the model received for that turn, not a paraphrase. The system prompt itself gets its own section, since it's usually the largest and most static part of the request and you rarely want it expanded by default.
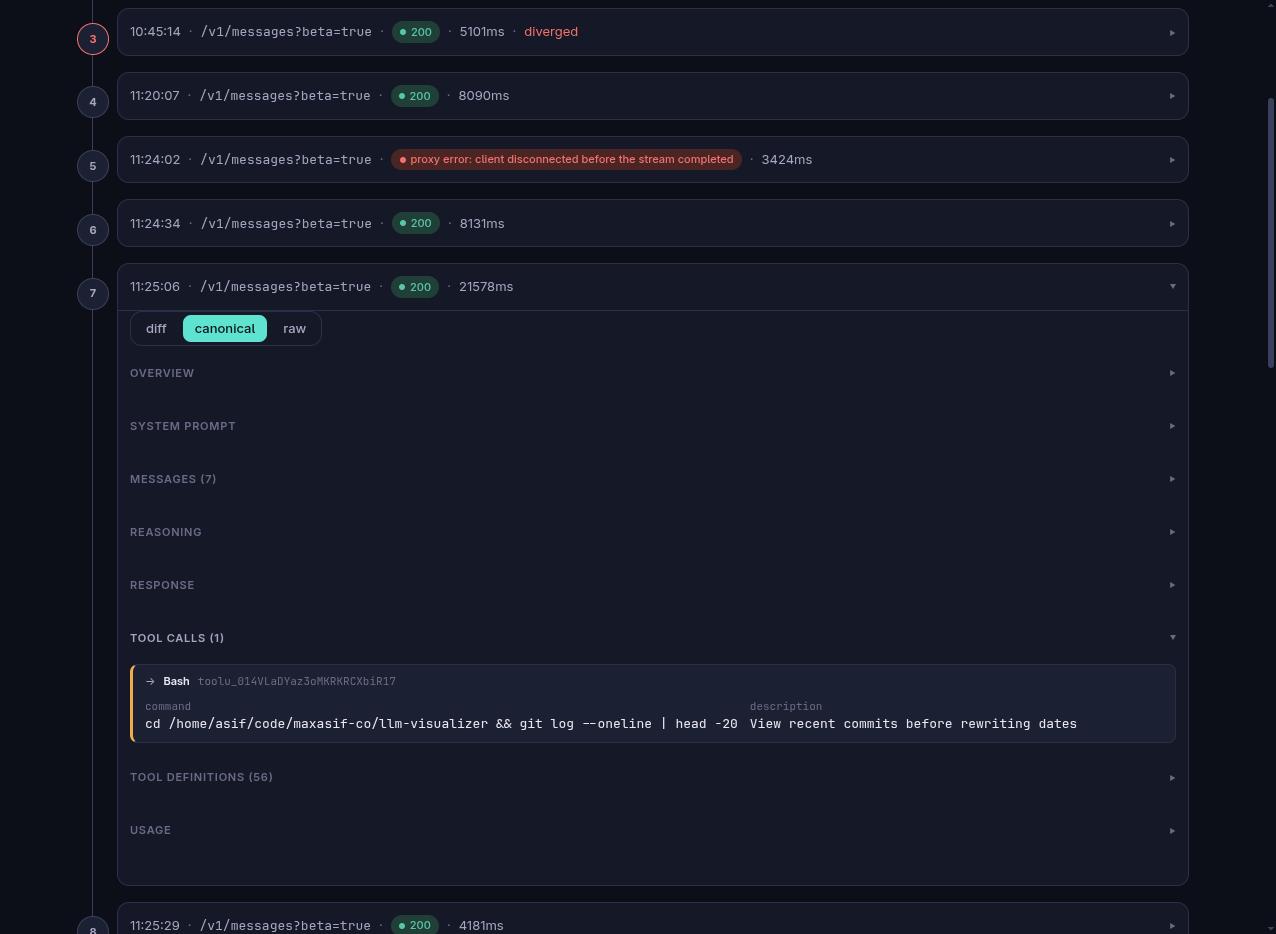
Tool calls and their results, paired up and labeled. Rather than hunting through JSON for a tool_use block and then separately for the tool_result that answers it, each is rendered as its own card — tool name, call ID, and arguments as a readable key/value table for the call; content and an error flag for the result. A Bash call, for example, shows up as its command and description, not an unlabeled blob sitting next to plain text:
Every individual SSE event, in order, for streaming responses. This is the one I actually reach for most. A streamed response isn't stored as one final blob of text — every chunk that came off the wire is kept separately, in the order it arrived, and the UI lets you scroll through them one at a time: message_start, content_block_start, a run of content_block_delta events as tokens (or thinking tokens) trickle in, ping keep-alives, all of it:
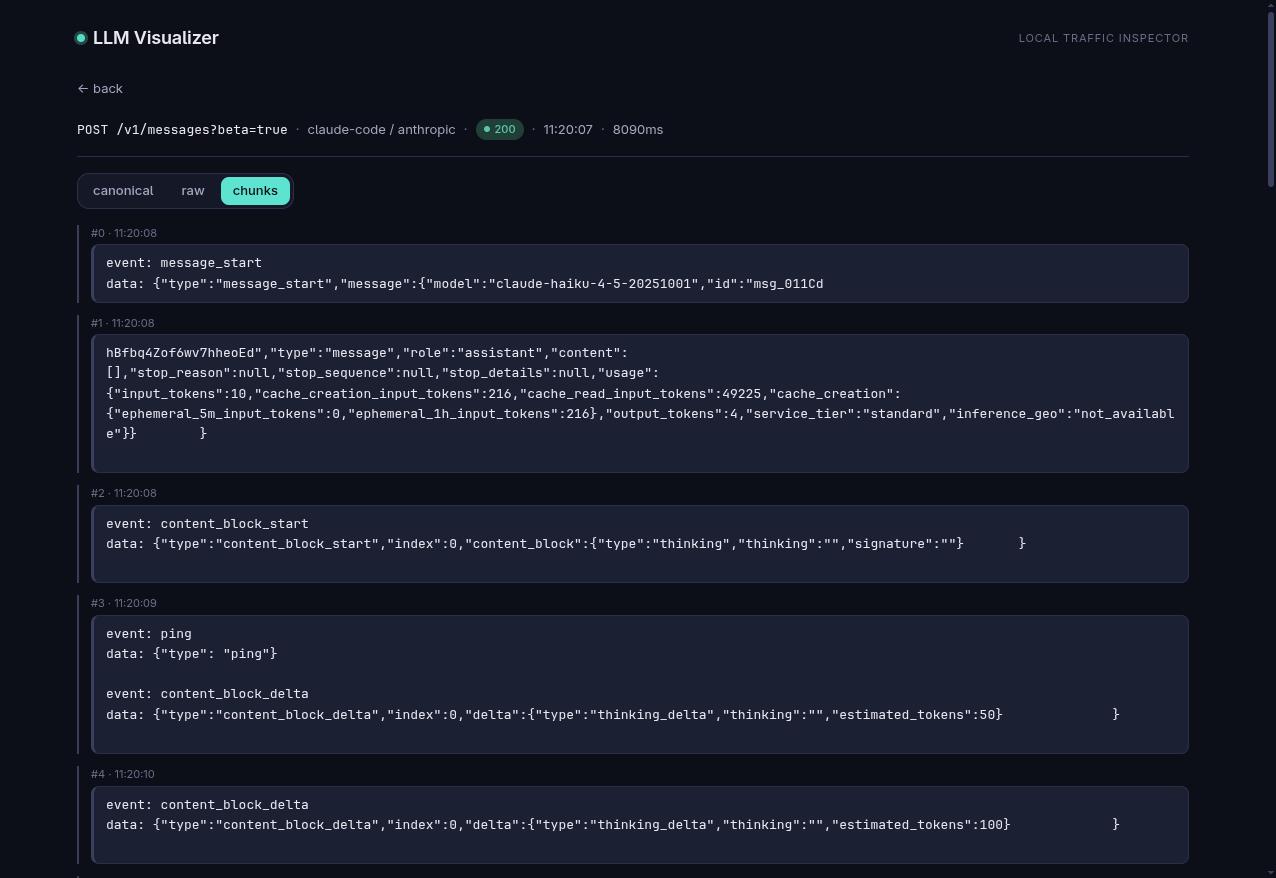
This is what makes it possible to tell where a stream actually stopped when something goes wrong mid-response, instead of just knowing that it did.
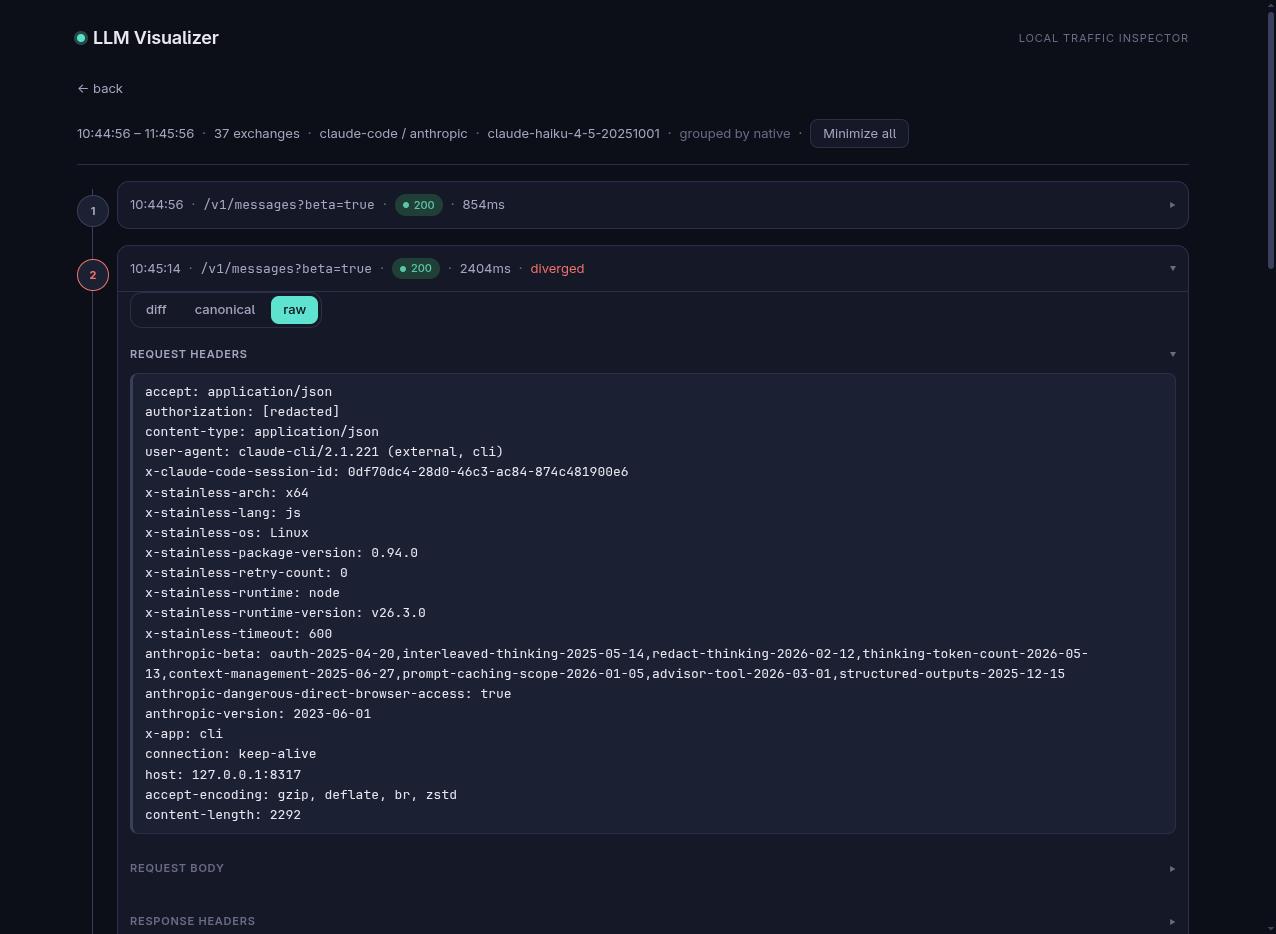
Headers, exactly as sent. Nothing about the request is hidden or reshaped — including headers you'd never think to look for. I found Claude Code's x-claude-code-session-id header sitting in plain view this way, by just reading the raw request:
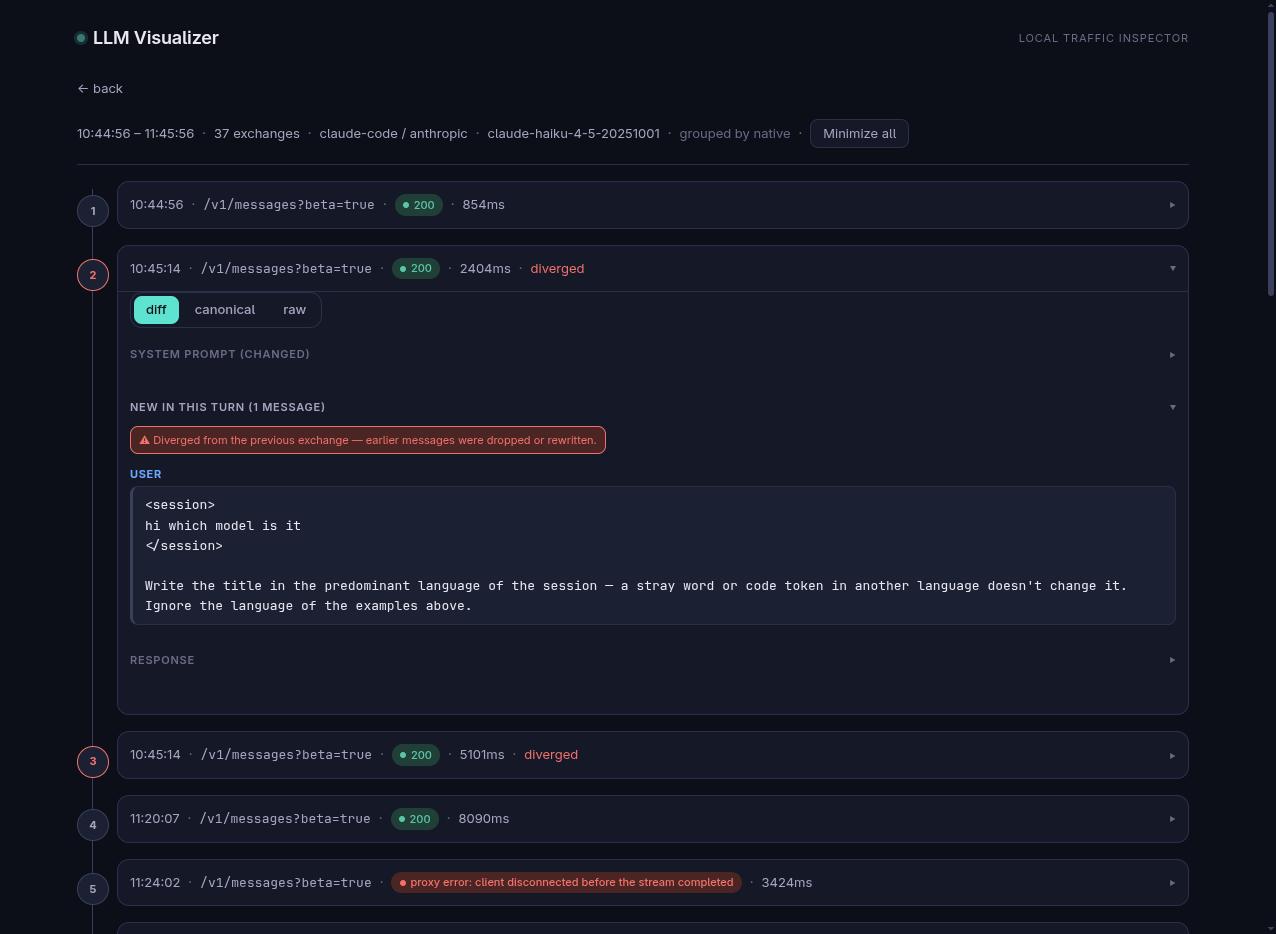
What changed since the last turn. Rather than re-reading the full message history on every exchange, the diff view shows only what's new — new messages, a changed system prompt, the response — and flags exchanges that dropped or rewrote prior context entirely (Claude Code does this for background tasks like title generation):
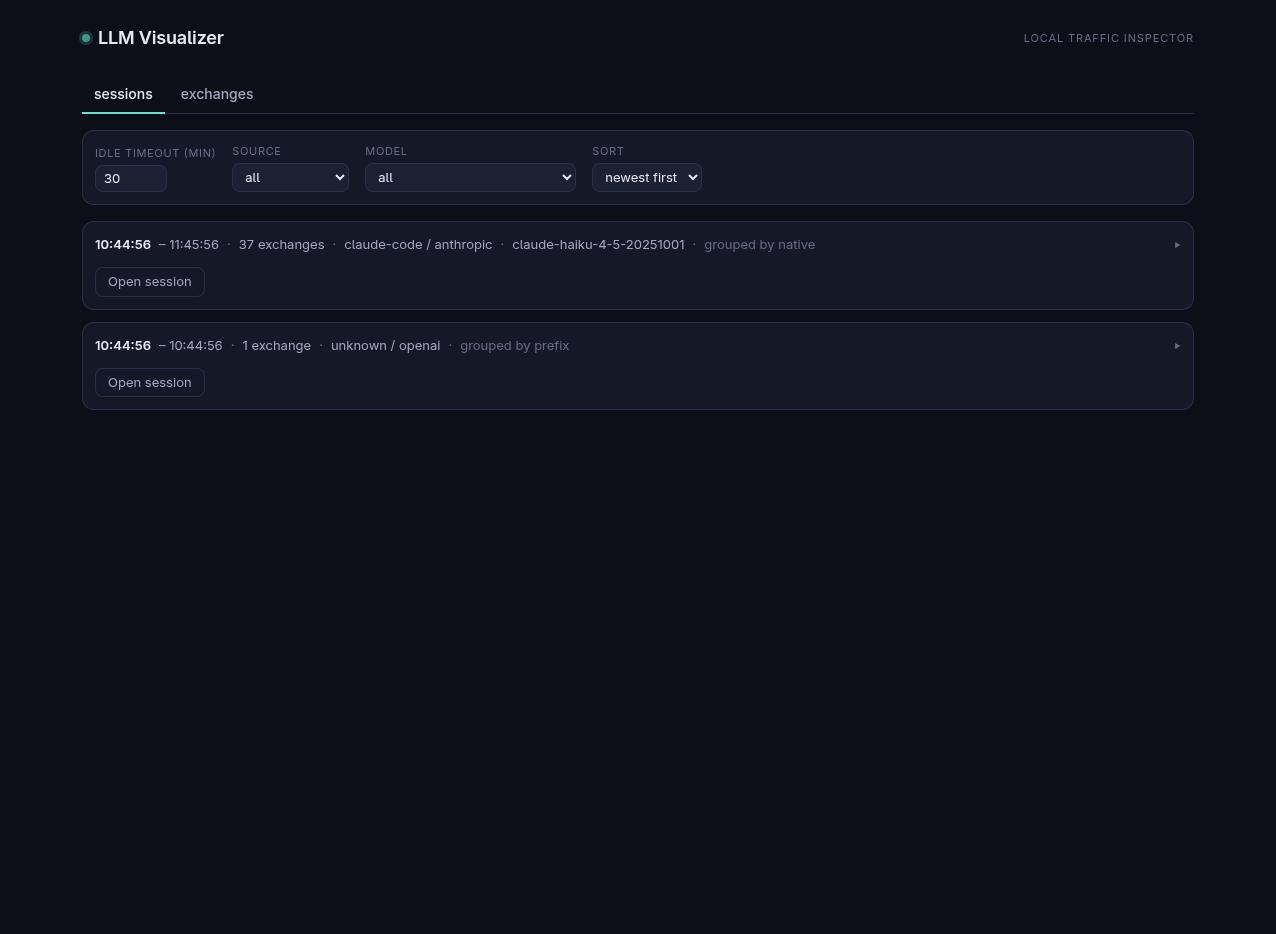
Sessions, grouped automatically. Exchanges from the same conversation are grouped into one session rather than listed as isolated, unrelated requests — so a real Claude Code run shows up as one 37-exchange session instead of a wall of disconnected rows:
How to use it
Fastest path is Docker — one command runs both services, sharing a volume for the SQLite file so they read and write the same data:
docker compose up --buildThat's the proxy on http://localhost:8317 and the viewer on http://localhost:5317, both up. No Node or pnpm needed locally. Running it directly instead: install and build, then run the proxy:
pnpm install && pnpm build
pnpm --filter @llmviz/proxy start
It listens on 127.0.0.1:8317 by default and logs everything to a local llmviz.db file. Point Claude Code at it:
export ANTHROPIC_BASE_URL=http://127.0.0.1:8317
claude
Or Codex CLI (via OPENAI_BASE_URL, or the base_url field in ~/.codex/config.toml depending on your version):
export OPENAI_BASE_URL=http://127.0.0.1:8317
codex
Both can point at the same running proxy at once — it detects which CLI is talking to it from the request shape, not from separate ports. Your real credentials still go straight through to the actual API; the proxy only reads and logs them (redacting the authorization header before writing to storage).
Then run the viewer — a small API server plus a Vite dev server for the UI (the Docker image runs the same two processes in one container instead):
pnpm --filter @llmviz/viewer dev:api   # reads llmviz.db, serves the API
pnpm --filter @llmviz/viewer dev       # UI at http://127.0.0.1:5317
Open http://127.0.0.1:5317, pick a session, and start expanding. Everything is collapsed by default — a real session runs to dozens of exchanges, and having it all open at once stops being readable fast — so click into whichever exchange, section, or SSE chunk you actually need.